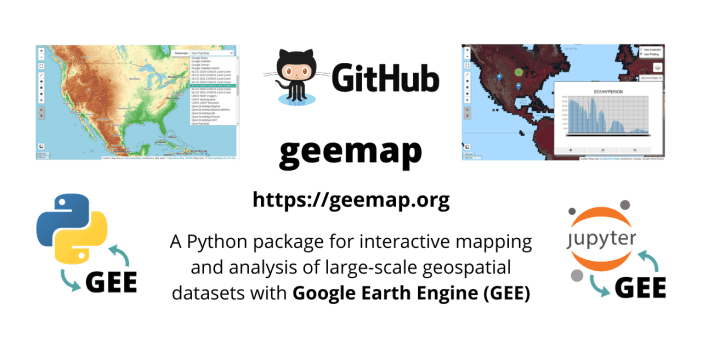
The geemap package is built upon ipyleaflet and ipywidgets, and enables users to analyze and visualize Google Earth Engine datasets interactively within a Jupyter-based environment.
Archive: Data-processing
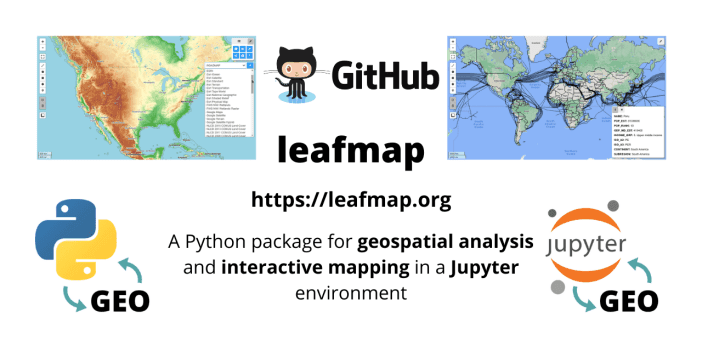
- The leafmap package is free and open-source, enabling users to analyze and visualize geospatial data with minimal coding in a Jupyter environment, such as Google Colab and Jupyter Notebook.
- Introducing a new Python package named geospatial that enables to install commonly used Python packages for geospatial analysis and data visualization with only one line of code.
- If you are interested in data analysis, data visualization, and modeling of geographic data in R, you should check out this free book by Robin Lovelace et al.
- Here is a step-by-step guide on quantifying land-use within a region using QGIS processing tools and the ESA WorldCover dataset.
- This post shows you how to reshape rasters using the Rasterio Python package and add dimensions to raster arrays.
- Here is a thorough ebook for learning GIS. Subjects include data visualization with QGIS, GIS and analysis tools, Earth observation and imagery analysis, and geospatial data processing.
- This course provides an introduction into core concepts and applications of data science based approaches to geospatial data analysis. You will find the materials for this course here.
- Actinia is an open source REST API for scalable, distributed, high performance processing of geographical data that mainly uses GRASS GIS for computational tasks. Learn more about it here.
- The spatstat package has extensive capabilities for exploratory analysis, statistical modelling, simulation and statistical inference with a strong focus on analysing spatial point patterns in 2D.