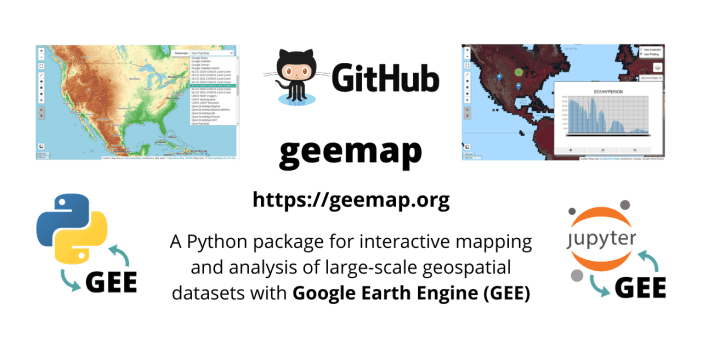
The geemap package is built upon ipyleaflet and ipywidgets, and enables users to analyze and visualize Google Earth Engine datasets interactively within a Jupyter-based environment.
Archive: Data-visualization
- Check here how to visualize change, explore trends, and find patterns in your data using line charts in ArcGIS Online Map Viewer.
- Check out these 15 practical cartography tips to use in ArcGIS Pro.
- Check out this lesson to predict the pattern of values across an entire area using interpolation in ArcGIS Online.
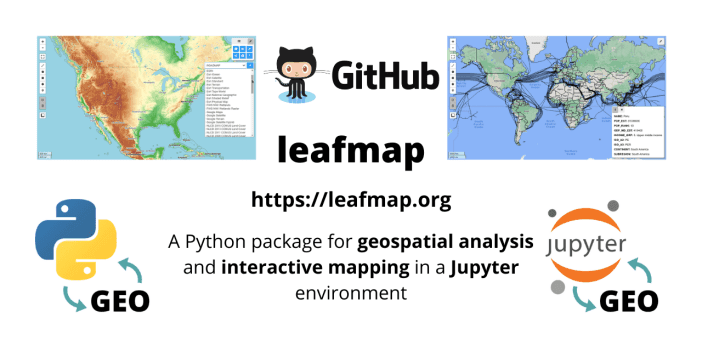
- The leafmap package is free and open-source, enabling users to analyze and visualize geospatial data with minimal coding in a Jupyter environment, such as Google Colab and Jupyter Notebook.
- Infographics cards are visualizations that provide contextual information about your map. Learn how to use infographics cards in your applications.
- Here is a video recording of a 90-min workshop introducing leafmap, featuring Dr. Qiusheng Wu, Assistant Professor of Geography at the University of Tennessee, Knoxville.
- River Runner is an application that visualizes the path of a rain droplet from any point in the world to its end point (usually an ocean or an inland water feature).
- Have you ever wanted to generate your own river maps using Python and open source data? Well, look no further, here is a full tutorial on just that.
- Here is a set of tutorials for building relative elevation models (REMs) in QGIS, creating beautiful visualizations of the results and exporting the images.